

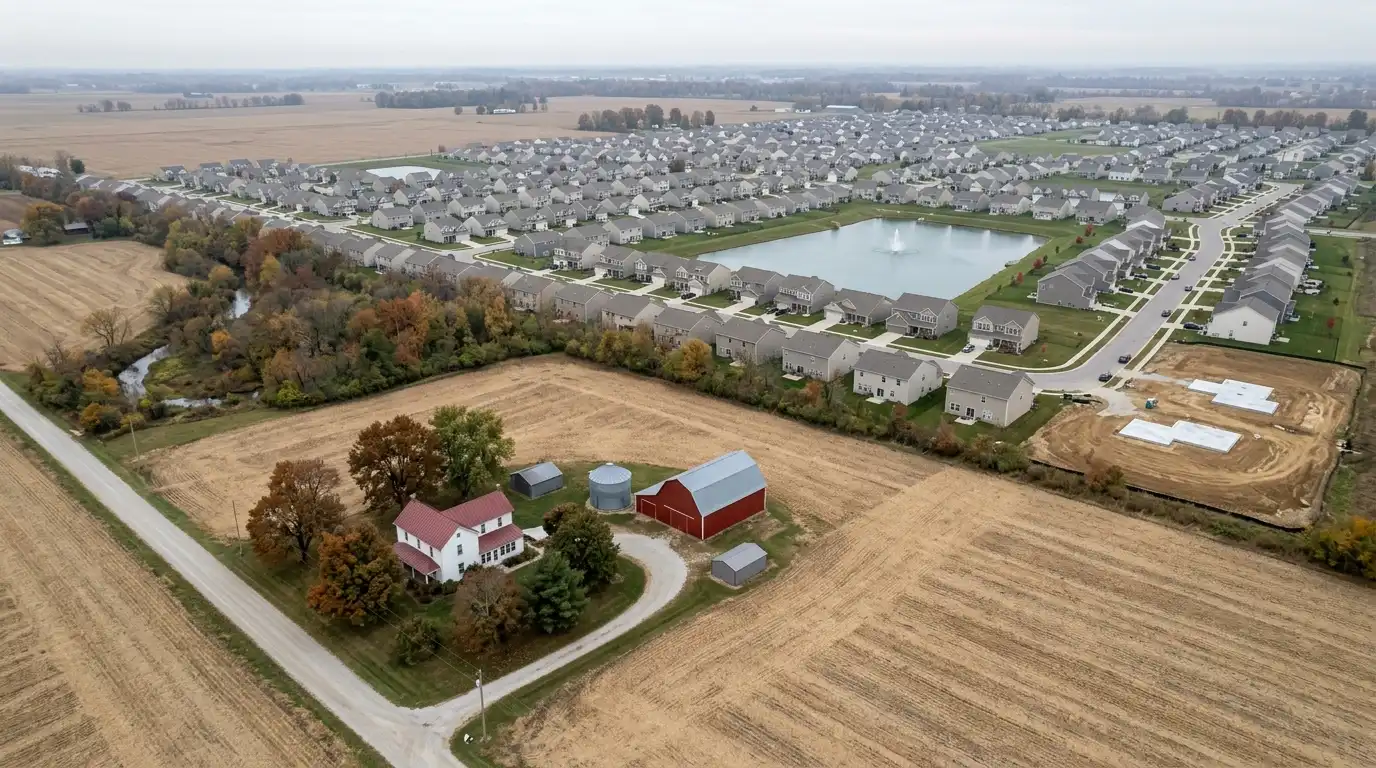
Published housing statistics for Boone County come from one place, the MIBOR REALTOR Association Market Insights Report, and they are published monthly at county level only, for single family homes only. In the July 2026 edition, the Boone County single family median sales price was $418,000, down 9.03 percent from July 2025, while closed sales rose 19.13 percent over that same July on July pairing. That report publishes nothing below the county line, so there is no Zionsville number, no Whitestown number and no Lebanon number in it, which is the honest answer to the question most people are actually asking when they ask what Boone County home prices are doing.
We work Hamilton County and Boone County every week, and the Boone County question comes up more than any other right now. The trouble is that almost every version of the answer circulating online is built by welding two numbers together that describe different time periods, or by presenting a county figure as if it described a town. This page does something narrower and more useful. It shows what data actually exists for Boone County, who publishes it, at what geography, on what schedule, and how to read it without arriving at a confident wrong conclusion.
Who publishes Boone County housing data, and how often?
The MIBOR REALTOR Association publishes a monthly Market Insights Report covering its 17 county central Indiana service area. The data comes from the MIBOR Broker Listing Cooperative, the local MLS, and the report carries a Domus Analytics copyright. MIBOR states its schedule inside the report: the data pull happens on the fifth day of the month for the prior month, and the completed report is posted by the second Friday of the month at mibor.com/marketinsights. The July 2026 edition carries a footer on every county page reading “Data provided by the MIBOR Broker Listing Cooperative, updated 08/04/26.”
The July 2026 edition runs to 30 pages, and the layout matters because it determines what you can and cannot look up:
- Page 1 is written market analysis, including a quote from MIBOR CEO Shelley Specchio.
- Page 2 is the MIBOR Market Summary, covering single family residences across all 17 counties in aggregate.
- Pages 3 through 12 are one page per metric, each carrying MIBOR’s own definition of the metric plus a county comparison chart.
- Pages 13 through 29 are one page per county, alphabetically from Bartholomew to Shelby. Boone County is page 14. Hamilton County is page 17.
- Page 30 is condominium data, and it covers all 17 counties combined.
Every county page is labeled “Data for Single Family Residence.” Condominium and townhouse activity is separated out entirely and published only at the 17 county level, so there is no Boone County condo figure in the report at all.
Why is there no Zionsville number and no Lebanon number?
Because the report stops at the county line. We went through the July 2026 edition page by page. There is no municipal page, no township page, no ZIP code page and no subdivision page anywhere in it. MIBOR also embeds an interactive dashboard from Domus Analytics on its Market Insights web page, but the citable, dated, downloadable artifact that a buyer or seller can check for themselves is the monthly PDF, and the monthly PDF ends at the county.
MIBOR does not publish a stated reason for stopping at the county line. What matters for a reader is the consequence, not the rationale. The consequence is that a “Zionsville median” or a “Lebanon median” you see quoted somewhere came from a different exercise: either an original pull from the MLS by whoever published it, or a portal’s automated estimate. Those are not equivalent. An MLS pull is checkable if the person who ran it tells you the geography filter, the property type filter, the date range and the pull date. A portal estimate is a modeled number, and we do not cite portals for figures on this site.
Deriving a town number from a county number is the one thing nobody should do. Boone County contains municipalities operating at very different price points and very different construction volumes, and the county median is a blend of all of them. Applying the blend back to one town is not analysis. It is invention with a decimal point on it.
What to ask for instead
If you want a Zionsville, Whitestown or Lebanon figure, ask for a Broker Listing Cooperative pull and ask that it be labeled with five things: the geography filter used, the property type, the date range, the date the data was pulled, and whether the number is a median or an average. Any figure that arrives without those five is not checkable, and a figure you cannot check is not a figure you should price a house on.
What does Boone County look like when you split it?
We cannot show you MIBOR sales data below the county line, because it does not exist. We can show you a different federal dataset that is published by place, which makes the point just as well. The US Census Bureau’s Building Permits Survey reports residential permits authorized by municipality every month, including a declared construction valuation.
| Boone County place | Single family permits, 2025 | Average declared construction valuation per permit, 2025 | Single family permits, Jan to Jun 2026 |
|---|---|---|---|
| Whitestown | 596 | $295,800 | 299 |
| Zionsville | 234 | $1,043,400 | 149 |
| Lebanon | 49 | $291,500 | 68 |
| Boone County Unincorporated Area | 28 | $497,400 | 8 |
Source: US Census Bureau, Building Permits Survey, place level file for the Midwest Region, calendar year 2025 (mw2512y) and year to date through June 2026 (mw2606y). Retrieved and computed by us on August 16, 2026. These are the Boone County places reporting single family permits to the survey in 2025. Jamestown reported one unit across zero months, which the Census imputes, so it is excluded; Thorntown and Ulen authorized none. The four places shown reported all 12 months in 2025 and all six months in 2026 with no imputation. Valuation is the declared construction valuation at time of permit and excludes land. It is not a sale price, a list price or an appraised value.
Read that table slowly. In one calendar year, inside one county, one town authorized 596 single family permits at a declared construction valuation averaging roughly $296,000, and another authorized 234 at roughly $1,043,000. Lebanon authorized 49. The unincorporated balance of the county authorized 28, at an average valuation that lands between the two extremes rather than near either. Those are not variations within a single market. They are different markets that happen to share a county assessor, and any single Boone County median is the weighted result of whichever of them happened to close that month. When the mix shifts toward the higher volume, lower valuation end, the county median falls even if no individual home lost value. That mechanism, not a collapse in prices, is the first thing to check whenever you see a county median move.
How do you read the table without getting it wrong?
MIBOR gives every county the same table, with eight columns: the current month, the prior month, month over month change, the same month a year ago, year over year change, year to date for the current year, year to date for the prior year, and the year to date change. Here is Hamilton County for July 2026, which we are using as the worked illustration because those figures survived our checking most cleanly.
| Hamilton County, single family | Jul 2026 | Jun 2026 | Jul 2025 | YTD 2026 | YTD 2025 |
|---|---|---|---|---|---|
| Median sales price | $489,990 | $522,713 | $483,250 | $490,000 | $475,000 |
| Closed sales | 601 | 670 | 576 | 3,450 | 3,275 |
| New listings | 678 | 728 | 654 | 4,241 | 4,215 |
| Median days on market | 12 | 7 | 13 | 9 | 7 |
| Average days on market | 35 | 30 | 28 | 37 | 30 |
| Percent of list price received | 99.2% | 99.7% | 99.2% | 99.2% | 99.2% |
| Active inventory | 916 | 832 | 845 | n/a | n/a |
| Months supply of inventory | 1.5 | 1.2 | 1.5 | n/a | n/a |
Source: MIBOR REALTOR Association, Market Insights Report July 2026, page 17, Hamilton County, single family residence. Data provided by the MIBOR Broker Listing Cooperative, updated 08/04/26. Retrieved August 16, 2026.
Three statements about Hamilton County’s median in July 2026 are all true at the same time, and they point in three different directions. It fell 6.26 percent from June. It rose 1.39 percent from July 2025. Year to date, it is up 3.16 percent on the same period last year. Nothing is contradictory here. Each one answers a different question, and the column you choose is the story you tell. That is why we name the county, the month, the property type and the comparison period every time we quote a figure, and why you should expect anyone quoting one at you to do the same.
Median days on market and average days on market are different numbers
MIBOR defines them separately in the report. Average days on market is “the average number of days between when a property is listed and the purchase contract date.” The median version is “the median number of days between when a property is listed and the purchase contract date.” Hamilton County in July 2026 shows a median of 12 days and an average of 35. Boone County in the same month shows a median of 27 and an average of 40. The gap between the two is the tail: a handful of listings sitting for a long time pulls the average up without moving the median. If someone tells you homes are selling in under two weeks and someone else says it takes over a month, they may both be reading the same row of the same table.
Active inventory and months supply are point in time, not totals
Active inventory is the count of properties available for sale at the end of the month. Months supply is how long that standing inventory would take to sell at the current monthly pace. Neither is a running total, and neither can be added up across months. Hamilton County ended July 2026 with 916 active single family listings against 845 a year earlier, an increase of 8.40 percent, while months supply held at 1.5 in both years, because sales volume rose alongside inventory. Boone County ended July 2026 with 213 active listings against 214 a year earlier, with months supply at 1.6 against 1.9.
Why does last month’s number change after it is published?
Figures for a given month change between editions. MIBOR restates the prior month when it publishes the next one, and the report does not state a reason. We compared the June 2026 report against the June column of the July 2026 report ourselves.
| June 2026 figure | As published in the June 2026 report | As restated in the July 2026 report |
|---|---|---|
| Hamilton County median sales price | $520,500 | $522,713 |
| Hamilton County closed sales | 659 | 670 |
| Hamilton County active inventory | 818 | 832 |
| Hamilton County median days on market | 8 | 7 |
| Boone County median sales price | $435,000 | $435,000 |
| Boone County closed sales | 154 | 158 |
| Boone County pending sales | 135 | 124 |
| Boone County active inventory | 205 | 207 |
Sources: MIBOR REALTOR Association, Market Insights Report June 2026, pages 14 and 17, and Market Insights Report July 2026, pages 14 and 17. Both retrieved and compared by us on August 16, 2026.
Boone County’s median held at $435,000 across both editions, so restatement does not move every figure. The direction is not uniform either. Closed sales and active inventory rose in both counties on restatement, and Hamilton County’s median moved up by $2,213, but Boone County’s pending sales fell from 135 to 124 and Hamilton County’s median days on market fell from 8 to 7. A restatement is therefore not simply late closings being added to the prior month. What the comparison establishes is that the figure you quote depends on the edition you read it in. A percentage change computed off an unrestated figure will be slightly wrong, and a percentage change quoted six months later off an old edition may be quite wrong.
One more mechanical warning about that table. Boone County’s July 2026 median days on market reads 27, against 8 in June. On 137 closed sales, that series swings hard from month to month, and we are not going to narrate a three week jump in market time from a base that small. Watch it over a quarter before you conclude anything from it.
Which Boone County numbers can you actually quote right now?
Three windows are currently published, and they do not agree on direction. That is the whole point of this page.
| Boone County, single family | Median sales price | Change | Closed sales | Change | Data pulled |
|---|---|---|---|---|---|
| July 2026 versus July 2025 | $418,000 | -9.03% | 137 | +19.13% | 08/04/26 |
| Year to date through July 2026 versus same period 2025 | $410,000 | -4.65% | 775 | +20.16% | 08/04/26 |
| Full year 2025 versus full year 2024 | $420,000 | +7.69% | 1,169 | -2.50% | 01/05/26 |
Sources: MIBOR REALTOR Association, Market Insights Report July 2026, page 14 (July 2026 and year to date figures) and Market Insights Report December 2025, page 14 (full year 2025 and 2024 figures). Single family residence only. Retrieved August 16, 2026. The full year line is as published in the December 2025 edition, pulled January 5, 2026. We have not rechecked it against a later edition, and by the mechanism described above it may since have been restated.
A seller reading the annual line sees a market that gained 7.69 percent last year. A buyer reading the monthly line sees a median 9.03 percent below where it was a year ago. Both are reading Boone County. What changed is the window, and underneath the window, the mix of what closed. Volume is up sharply on both 2026 measures, which is the more stable signal here, because volume is a count and a count is not sensitive to which price points happened to transact.
The sentence to never write
Do not pair a price change from one period with a volume change from a different period in the same sentence. “The median fell while sales rose” is only meaningful when both halves are measured over the same window. On a July on July basis, Boone County’s median was down 9.03 percent and closed sales were up 19.13 percent. On a year to date through July basis, the median was down 4.65 percent and closed sales were up 20.16 percent. Pick one basis, state which one, and stay on it for the whole paragraph.
What do these numbers not cover?
Quite a lot, and knowing the boundary is most of the skill.
- Assessed value and property taxes are not in this data. Assessed value is set by the county assessor and administered under rules from the Indiana Department of Local Government Finance. It is a separate system from sales reporting and the two figures will not match.
- New construction appears in the county tables on a row labeled “New Construction Sales Price,” but MIBOR does not label that row a median, and the row directly above it is explicitly labeled “Median Sales Price,” so we do not describe it as a median. In the July 2026 edition the percentage cells on that row do not reconcile with the dollars beside them: Hamilton County’s month over month cell reads -0.09 percent where $550,885 in June to $499,900 in July works out to -9.26 percent. Compute from the dollar figures, not from that row’s percentages. For reference, Boone County’s July 2026 new construction sales price was $400,450 against a county median of $418,000, and Hamilton County’s was $499,900 against a county median of $489,990.
- Condominiums and townhouses are excluded from every county page and published only across all 17 counties combined.
- Nothing in this report describes a neighborhood, a school district or a specific street. County statistics cannot answer a question about one address.
On the tax side, this page describes how published data works and is not tax or legal advice. For your own parcel, contact the Boone County Assessor for assessed value and the Boone County Treasurer for billing, and speak with a licensed Indiana tax professional or attorney before acting on anything related to property tax.
Frequently Asked Questions
What is the median home price in Boone County right now?
The most recent published figure is $418,000 for single family homes in July 2026, from the MIBOR Market Insights Report published in August 2026. That is 9.03 percent below July 2025 and 3.91 percent below June 2026. Year to date through July 2026 the median is $410,000, down 4.65 percent from the same seven months of 2025. All three are correct and they describe different windows.
Is there a published median sales price for Zionsville, Whitestown or Lebanon?
Not in MIBOR’s monthly report. It publishes at two geographies only: the 17 county service area in aggregate, and each county individually. There is no municipal, township or ZIP code page anywhere in the July 2026 edition. Any town level figure you see came from a separate MLS pull or from a portal estimate, and it should be labeled with its source, filters and pull date.
Why do I see one percentage quoted and someone else quotes a different one for the same county?
Almost always because you are looking at different comparison periods, or at different editions of the report. Month over month, year over year and year to date all produce different numbers from the same table, and MIBOR restates the prior month when the next report comes out. Ask which month, which comparison and which edition, and the discrepancy usually resolves itself.
Does MIBOR publish condo data for Boone County?
No. Condominium and townhouse data is separated from the single family series and published only for the full 17 county service area, on the last page of the report. There is no per county condo page, so there is no published Boone County condo median.
How current is the monthly report?
MIBOR states inside the report that the data pull happens on the fifth day of the month for the prior month, and that completed reports are posted by the second Friday of the month. The July 2026 county pages carry a data stamp of 08/04/26. So the freshest published county figure is generally between one and six weeks old depending on when you look.
Why did last month’s number change in this month’s report?
MIBOR restates the prior month when it publishes the next edition, and the report does not state a reason for it. We checked the behavior ourselves. Comparing the June and July 2026 editions, Hamilton County’s June median moved from $520,500 to $522,713 and its June closed sales from 659 to 670, while Boone County’s June closed sales moved from 154 to 158 and its June median did not move at all. The movement is not all in one direction either: Boone County’s June pending sales fell from 135 to 124. Cite the edition, not just the month.
Are these numbers the same as my assessed value?
No. Sales statistics come from the MLS and describe what closed. Assessed value is determined by the county assessor under state rules and drives your tax bill. They are different systems built for different purposes and they will not agree. For questions about your own parcel, go to the county assessor, and talk to a licensed Indiana tax professional or attorney before you act on anything tax related.
Does a builder’s new construction sale show up in these figures?
The county pages carry a New Construction Sales Price row, so new construction is represented in the report. MIBOR does not label that row a median, and in the July 2026 edition its percentage change cells do not reconcile with the dollar figures beside them, so use the dollars. In July 2026 Boone County’s new construction sales price was $400,450 against a county median of $418,000, and Hamilton County’s was $499,900 against a county median of $489,990.
Is Boone County a buyer’s market or a seller’s market?
The published measure is months supply of inventory, which stood at 1.6 for Boone County at the end of July 2026 against 1.9 a year earlier, and 1.5 for Hamilton County against 1.5 a year earlier. Across the full 17 county service area, MIBOR CEO Shelley Specchio is quoted in the July 2026 report saying that active inventory is up 17.4 percent from last year, “which is beginning to ease some of the competitive pressure buyers have faced.” She adds in the same quote that the region is not at a balanced market yet, that supply is still tight by historical standards, and that the trend over the past several months has been a steady move in that direction. That is a regional statement, not a Boone County one, and no published figure describes any single town.
Related pages
- Zionsville, which carried the highest average declared construction valuation per single family permit of any Boone County place reporting to the Census survey in 2025
- Whitestown, which authorized the most single family permits of any Boone County place in 2025
- Carmel and Westfield in Hamilton County, the counterweight to the Boone County figures on this page
- Fishers and Noblesville, also inside the Hamilton County series quoted above
Want the numbers for your actual address?
County statistics cannot price a house. If you want to know what is happening on your street, in your price band, with the filters and the pull date stated so you can check the work, tell us the address and we will run it and show you where every figure came from.